Customized Dashboards in Microsoft Dynamics NAV

#FocusOnBestPractices

How to Deploy Tailored NAV Dashboard Solutions to Your Organization’s Unique Goals

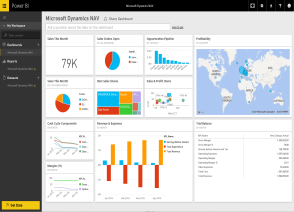
Microsoft Dynamics NAV Dashboards have been one of the highest priorities in the Business Intelligence (BI) marketplace since Gartner’s 2013 Financial Executive International CFO Technology Study. Today’s fast-paced business demands require decision-making to be user friendly and accessible for all levels of the company. NAV Dashboards, scorecards, and similar tools make company performance analysis straightforward. More specifically, dashboards are business intelligence visualizations of company data. They utilize key performance indicators (KPIs) to demonstrate your organization’s trends, successes, and challenges – either collectively, departmentally, or focused on a project.
Customized Dashboards in Microsoft Dynamics NAV
BI dashboards get their name from the automotive industry, where clusters of instruments (or virtual instruments in the modern world) allow drivers to make educated, real-time decisions based on the speed, temperature, and RPMs. Similarly, BI dashboards empower corporate decision-makers to understand the overall health of the company at a glance. Moreover, dashboards in the BI world are crafted for interaction, adjustment, and interpretation, inviting drill-to and drill-down capabilities, allowing you to adequately understand the data from Dynamics NAV to make the best decisions about the future of your company.

Let’s look at some technology and understand before investing in a functionality upgrade to Microsoft Dynamics NAV.

Primarily, dashboard solutions can pull their information from disparate sources. You can produce dashboards live from Dynamics NAV, analyzing real-time data. This option empowers users to know how the company is presently performing. The ability to analyze data in real-time from NAV is optimal when managers, CFOs, or accountants must have real-time reports. They are also helpful to smaller organizations that might not have the time and money needed to manage a BI database, like an online analytical processing (OLAP) cube or a data warehouse.
On the other hand, larger corporations probably need something a little faster and more stable than just integrating live from Dynamics NAV. An OLAP cube or data warehouse integration allows larger teams to generate Data visualization dashboards without the sometimes slow data queries from NAV for real-time analysis. The data storage source integration is perfect for high performance BI. However, replicating data from Dynamics NAV to the OLAP cube or data warehouse is a requisite. Pulling from a stable BI data storage source ensures that the Dynamics NAV server does not have to slow down.
Customized Dashboards in Microsoft Dynamics NAV
At the same time, you can also consider the hybrid solutions that offer both methods. There are several solutions that empower users with the ability to produce dashboards live from NAV and/or pull from a static data source. Real-time analyses are usually utilized for important operational data reporting, as in inventory or sales analysis where department heads may require up-to-the-minute information. Other data visualizations only require periodical updates because they are focused on routine analysis (weekly, monthly, quarterly), so utilizing an OLAP cube or Data Warehouse integration is sufficient.
Microsoft Dynamics reporting enhances this process by providing flexible options for real-time and periodic reporting across your data sources. With Microsoft Dynamics reporting, you can easily integrate both static and dynamic data views, allowing for a tailored approach to business intelligence that fits your organizational needs.

There are additional aspects that you should consider when implementing the right product.

Additional Aspects
Data visualization solutions work on different technology platforms, and it is essential to comprehend the differences. Microsoft Dynamics reporting simplifies this by providing a unified platform for generating clear, insightful visualizations. Some third-party dashboards run on a proprietary server. These all rely on a vendor-specific interface, resulting in a potentially big learning curve for those that are used to Excel. Some products wow with their graphical capabilities but require an education on unique formatting and functionalities. Microsoft Excel and Dynamics NAV come equipped with their own dashboard options but are organically restricted in their abilities because dashboards are not the focus of either product. There are add-in products that also function within Excel.

Contact Korcomptenz, your Microsoft Dynamics NAV partner to fulfill your organizational goals effectively using the most efficient dashboards.

Share this article

Share on facebook
Facebook
Share on linkedin
LinkedIn
Share on twitter
Twitter
Related articles
Share on facebook
Share on linkedin
Share on twitter